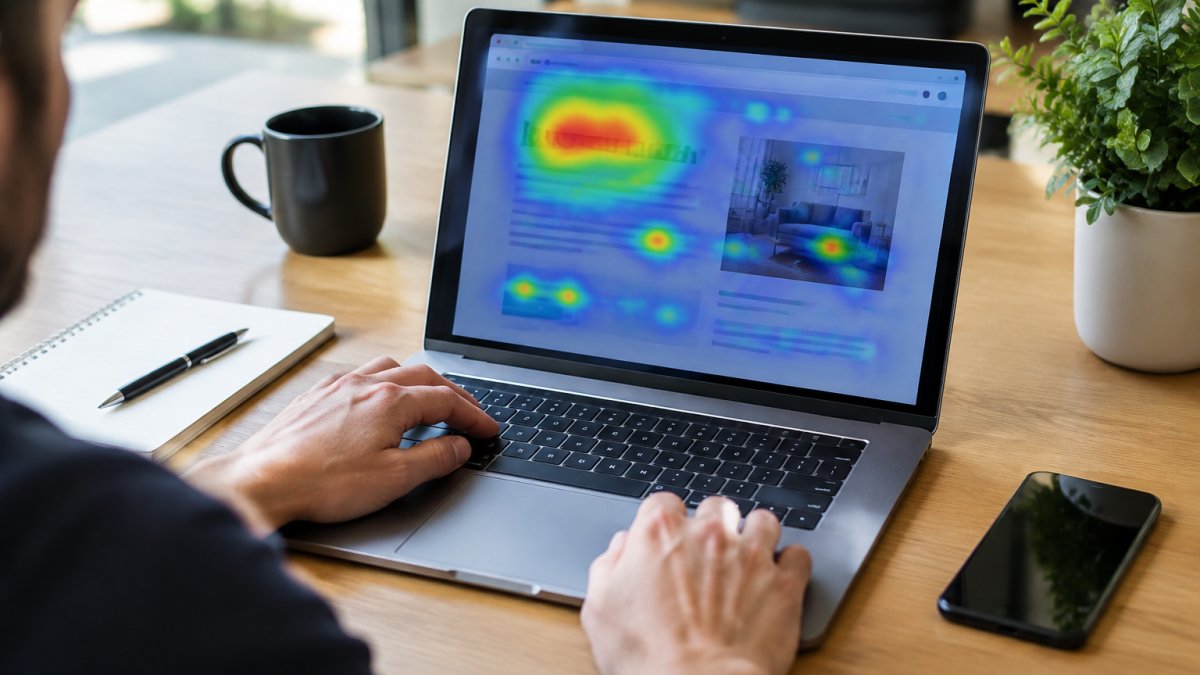
7 Heatmap Techniques That Improve Website Design
Last Updated: November 19, 2026
Quick Summary
Use heatmap techniques to turn click, scroll and movement data into design hypotheses you can test. Pair each pattern with a page goal, change one element at a time, and compare results before and after to confirm the fix worked.
- Click maps test whether buttons and links get found; scroll maps show where attention drops off.
- Wait until a page has at least a few hundred sessions before trusting the colours.
- Colour scales are not standardised between tools, so compare patterns within one tool and date range.
- Run a separate mobile heatmap for every key page to catch missed taps and CTAs below the fold.
- Changing a page from a single snapshot with no baseline or test can make conversion worse.
Table of Contents
- What Website Heatmaps Actually Show You
- The Three Heatmap Types: Click, Scroll and Movement Maps
- How to Interpret Heatmap Data Without Guessing
- Heatmap Examples for Website Design Problems
- Heatmap Tools for Websites: What to Look For
- Running Website UX Optimisation on Mobile Screens
- Common Heatmap Mistakes That Waste Your Traffic Data
- Book a Heatmap Review With Web Maniacs
- Frequently Asked Questions
What Website Heatmaps Actually Show You
A website heatmap is a colour-coded picture of what visitors do on a page, and heatmap techniques turn that picture into evidence, not what visitors say they do. It tracks clicks, taps, scrolling and mouse movement, then turns that raw interaction data into a visual overlay you can read at a glance.
Here’s the catch most guides skip: a heatmap is a visualisation of data, not an insight by itself. As EyeQuant’s guide to website heatmaps puts it, there is zero insight until you understand which data the colours represent. Red means “lots of activity here”, but activity is not the same as success.
The colours show you where attention goes. Your job is to work out why.
So how do you use heatmaps to improve website design without drowning in pretty screenshots? You pair the visual with a question, a hypothesis and a test. That’s the whole method, and the seven techniques below build it out.
The Three Heatmap Types: Click, Scroll and Movement Maps
Each heatmap type answers a different question. Pick the wrong one and you’ll misread the page.
- Click maps show where people click and tap. Use them to test whether buttons, links and menu items get found.
- Scroll maps show how far down the page visitors travel. Use them to spot where attention drops off.
- Movement maps track mouse movement and eye-level attention patterns. Use them to see what gets looked at versus what gets clicked.
A click map tells you a button was ignored. A scroll map tells you nobody saw it. Those are different problems with different fixes, and confusing them wastes weeks of design work.
How to Interpret Heatmap Data Without Guessing
Reading a heatmap well means asking three questions before you change a single pixel: what data is this, how many sessions back it, and what would “good” look like here? Answering those three questions in writing, before opening the tool, helps separate a useful review from a redesign based on a pretty screenshot.
Start with volume. A heatmap built on a handful of sessions is noise. As a working rule, wait until a page has at least a few hundred sessions across the device types you care about before you trust the colours, and treat any pattern that appears in only one session as an anecdote rather than a finding. Then check the device split, because a desktop click map and a mobile tap map rarely tell the same story. If a page gets most of its traffic on phones, a desktop-only heatmap is telling you about a minority of your visitors.
Next, define success for that page in a single sentence. A landing page wants clicks on the call to action. A blog post wants scroll depth and reading time. A checkout step wants form completion. Judge the heatmap against that goal, not against how busy it looks. A page can be covered in red and still be failing if all the activity is on elements that do not move anyone toward the goal.
Then apply a simple decision rule to every pattern you spot. If the pattern is strong, repeats across sessions, and lines up with a page goal, it is a candidate for a design change. If it is strong but does not line up with a goal, it is a distraction to note and set aside. If it is weak or appears in only a few sessions, it is noise. Writing the rule down stops the review from drifting into opinion.
Watch out: colour scales are not standardised between tools, so a red patch in one product may represent a different volume of activity than a red patch in another. Compare patterns within a single tool and a single date range, never across tools or across a redesign.

Once you have a clear read, the next step is turning it into higher conversions. Our guide on how to improve website conversion rates walks through the fixes that follow a heatmap review.
Heatmap Examples for Website Design Problems
A table of symptoms is useful, but the real skill is turning a heatmap pattern into a design hypothesis you can test. Here are the patterns we see most often, what each one usually means, and how to turn it into a change you can measure.
| What the heatmap shows | Likely problem | Design hypothesis to test |
|---|---|---|
| Clicks clustered on non-clickable text | Visitors expect a link | Making the text a button will increase clicks on the intended next step |
| Heavy clicks on the logo and nav | Page content isn’t clear | Sharpening the headline will reduce nav clicks and increase scroll depth |
| Scroll drop-off above the CTA | CTA sits too low | Moving the call to action higher will increase CTA clicks |
| Cold spots around key features | Weak visual hierarchy | Increasing contrast and size will raise interaction with those features |
| Rage clicks on a form field | Form friction | Simplifying the field or label will reduce repeat clicks and form abandonment |
Take the scroll drop-off pattern as a worked example. A services page shows strong engagement through the first two sections, then a sharp fall-off just above the enquiry button. The hypothesis is not “move the button” on its own; it is “the button sits below the point where most visitors stop reading, so moving it above the drop-off will increase enquiries.” You change one thing, keep the rest of the page stable, and compare the CTA click rate and scroll depth before and after over a comparable period. If the CTA click rate rises and scroll depth holds, the hypothesis was supported. If nothing moves, the drop-off was probably caused by something else, such as a slow-loading section or a confusing block of copy, and the next test should target that instead.
A second common example is rage clicks on a form field. Visitors tap or click the same spot repeatedly because the field looks interactive but is not, or because a validation message is not visible. The hypothesis is that clarifying the label or the field state will reduce repeat clicks and abandonment. Measure both the rage-click count and the form completion rate, because a drop in rage clicks with no change in completion tells you the friction moved rather than disappeared.
These heatmap examples for website design all point to the same lesson behind good heatmap techniques: the data shows the symptom, and your design hypothesis explains the cause. Test one change at a time so you know what worked, and keep a short written record of the hypothesis, the change, and the result so the next review starts from evidence rather than memory.
Heatmap Tools for Websites: What to Look For
The right heatmap tools for websites do three things well: they capture clicks, scrolls and movement, they segment by device type, and they connect behaviour to outcomes like conversion rate.
When you’re comparing options, check these boxes:
- Session recordings alongside heatmaps, so you can watch the behaviour behind the colours
- Device and screen-size segmentation for mobile experience checks
- Integration with your analytics and A/B testing setup
- Consent and privacy controls that fit your obligations
- Enough session volume to make patterns reliable
Skip any tool that only shows pretty colours with no session context. You’ll spend more time guessing than deciding.
Running Website UX Optimisation on Mobile Screens
Mobile is where heatmap analysis earns its keep. Tap behaviour, thumb reach and smaller screens create friction points that never show up on desktop.
Run a separate mobile heatmap for every key page. Look for taps that miss buttons, forms that lose people at a field, and CTAs that fall below the fold. Then check page performance, because slow load times skew the data and frustrate visitors before they interact at all.
If mobile is your weak spot, our article on how trades can build a mobile-friendly website that generates leads goes deeper into the build side.
Common Heatmap Mistakes That Waste Your Traffic Data
The biggest mistake is treating a heatmap as a verdict. It’s evidence. Read it alongside session recordings, analytics and A/B testing before you redesign anything.
Other traps to avoid:
- Judging a page on too few sessions
- Ignoring device type when reading click tracking
- Forgetting that page load speed affects where and whether people interact
- Chasing every red patch instead of the ones tied to your conversion funnel
- Skipping privacy and consent when you record visitor behaviour
Watch out: changing a page based on a single heatmap snapshot, with no baseline and no test, is how teams “fix” a design and make conversion worse. Always compare before and after.
If slow pages are muddying your data, read does page load speed really affect user experience before you trust the colours.
Book a Heatmap Review With Web Maniacs
The fastest way to turn heatmap data into design decisions is to have someone read it with you.
Web Maniacs offers custom software development, website design and mobile app creation, alongside results-driven digital marketing.
You can see what we offer on our professional website design services page, then get in touch to talk through your goals. No jargon, no vanity screenshots, just a clear plan for what to change and why.
Heatmaps only pay off when someone acts on them. If you want a second set of eyes on your data, Web Maniacs can review your pages, pinpoint the friction, and rebuild the layout around how visitors actually behave. Get started with Web Maniacs and turn your heatmap insights into a site that converts.
Frequently Asked Questions
How much website traffic do you need for a useful heatmap?
Heatmaps need enough sessions per page before the colours mean anything. As a working rule, wait for several hundred sessions on a single page before drawing conclusions, and treat anything under a hundred as anecdotal. Low-traffic pages are better judged with session recordings and click tracking reviewed over a longer window. If your site is new, start with your highest-traffic landing page and your checkout or enquiry form, where even modest volume reveals friction points quickly.
Can heatmaps show why visitors leave a page?
They show where attention and clicks stop, not the reason. A scroll map that ends halfway down tells you visitors never reach your call to action; it does not tell you whether they were bored, confused or simply finished reading. Pair heatmap data with session recordings, form interaction data and A/B testing to test a design hypothesis. The heatmap flags the drop-off point, the recording explains the behaviour, and the test proves whether your fix works.
How often should you review website heatmaps?
Review them after every meaningful design or content change, and otherwise on a monthly cycle for key pages such as landing pages, product pages and forms. Seasonal shifts change visitor behaviour, so compare like-for-like periods rather than mixing months. Keep a short log of what you changed and when, so a later heatmap can be matched to a specific design hypothesis. Without that record, you end up re-analysing the same pages and drawing the same conclusions.
What design problems can heatmaps reveal that analytics cannot?
Standard analytics counts visits and conversions; heatmaps show where on the page those things happen. They expose dead zones where no one looks, elements that attract clicks but are not links, calls to action sitting below the scroll depth most visitors reach, and form fields that get abandoned. They also surface tap behaviour on mobile, where a button that looks clickable but is too small becomes an obvious friction point once you see the misdirected taps clustered around it.